Archive · Maps & Geography
Interactive map of Pangaea / Pangea with present-day borders and a globe
Interactive map of the supercontinent Pangaea together with the interactive 3D globe showing the Pangaea with present-day country borders.

This map combines a reconstruction of the supercontinent Pangaea (also called Pangea) with present-day political borders. The borders are a modern orientation aid: they make it easier to compare the reconstruction with the world you know, but they are not a claim about ancient countries or exact national locations.
Massimo Pietrobon created the original map, and with some modifications, it was transformed into an equirectangular projection, making it suitable for 3D projection on a globe.
Pangaea on a globe
Drag to rotate. Pinch, scroll or use the controls to zoom. Arrow keys rotate, plus and minus zoom, and 0 restores the opening view.

Reading note: the map is a visual comparison tool. It cannot determine an exact historical location for a modern state, city or coastline.
What is Pangaea?
Pangaea was assembled during the late Paleozoic and remained a single landmass until roughly 200 million years ago. It brought together earlier continental blocks including Gondwana, Euramerica and Siberia. Geological reconstructions become less precise the farther back in time they go, so dates describe long processes rather than one instant when the supercontinent switched on or off.1
The name Pangaea comes from the Ancient Greek pan (meaning all, entire) and Gaia or Gaea (meaning land, Earth, or even Mother Earth).
Our world is a dynamic place, which holds for such fundamental events as the formation of continents and ocean masses. Plate tectonics offers incredible insights into how our planet came to be and what its future might look like.
Pangaea broke into continental fragments that now sit on moving lithospheric plates. Continents do not plough independently through a fixed ocean floor: both continental and oceanic crust are parts of the plate-tectonic system. Its boundaries are where much of Earth's earthquake, volcanic and mountain-building activity is concentrated.
Travel far enough back through that history and much of Earth's land is joined in one supercontinent.
The origin of Pangaea – continental drift hypothesis
In the early 20th century, Alfred Wegener, a German climatologist, geophysicist, and polar researcher, developed his theory of continental drift (or a continental drift hypothesis).
Wegener argued that continents had moved relative to one another. He did not have a workable mechanism, and his idea was widely contested at the time. Later evidence from the ocean floor, seafloor spreading, magnetic reversals and plate boundaries supplied the physical framework now known as plate tectonics.2
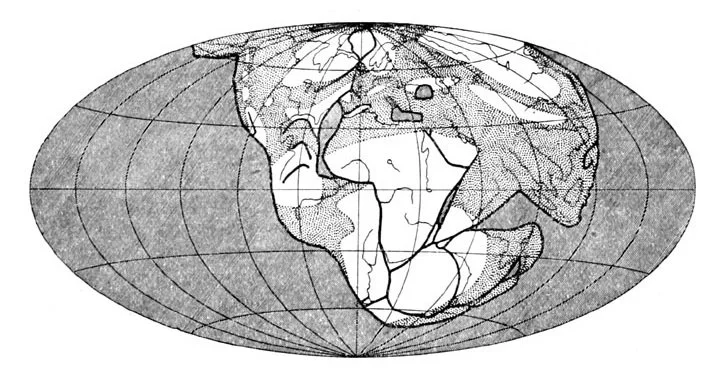
Wegener used maps like this to make the case visible. They were an important step, but the modern explanation comes from plate tectonics rather than continents sliding through an unchanged ocean bed.
Evidence of existence
Wegener was not the first person to suggest that ancient continents had once been joined.
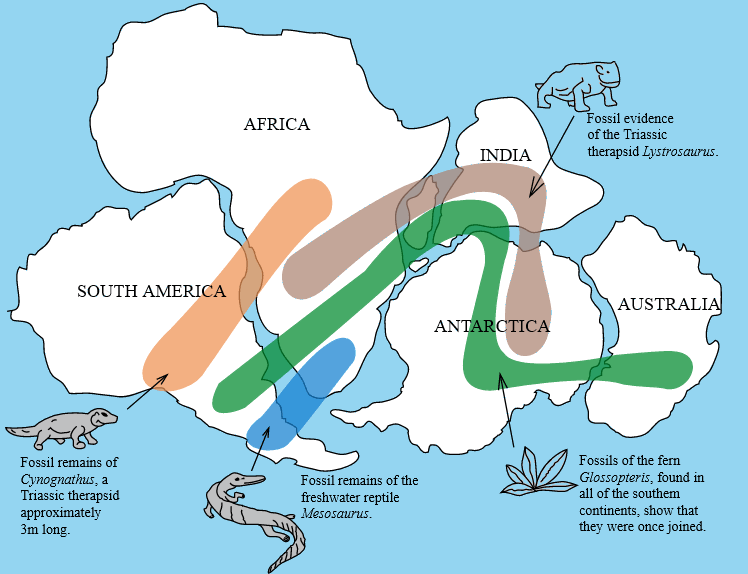
As early as 1596, Brabantian cartographer, Abraham Ortelius, suggested that the seemingly close fit of North America and South America on the one side of the Atlantic Ocean and Europe and Africa on the other was not just a coincidence.
The coastlines are only a clue. The stronger case combines matching fossils, rock sequences, ancient climates and mountain belts on landmasses now separated by oceans.3
Pangaea break-up
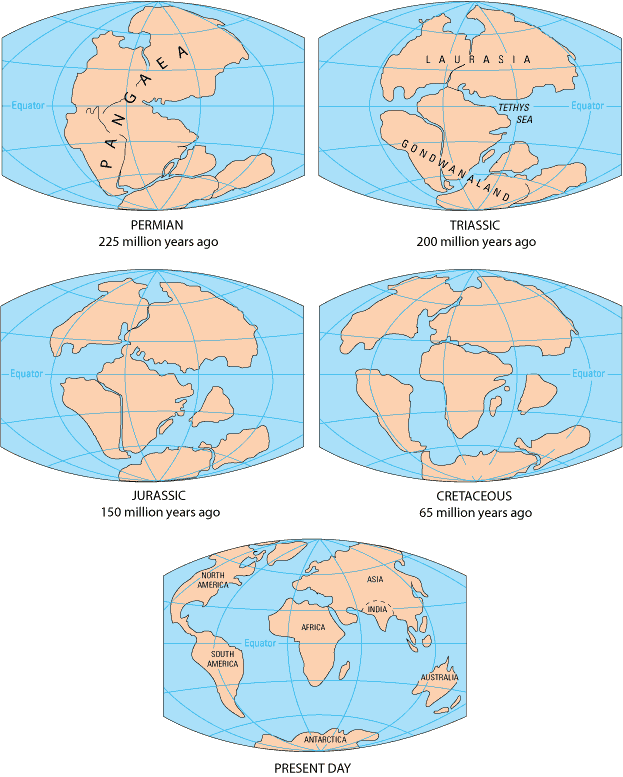
Rifting began around 225 to 200 million years ago and unfolded over tens of millions of years. The Atlantic widened as the fragments diverged; plate motion continues today, although not as one uninterrupted "break-up" event.4
The full map behind the globe
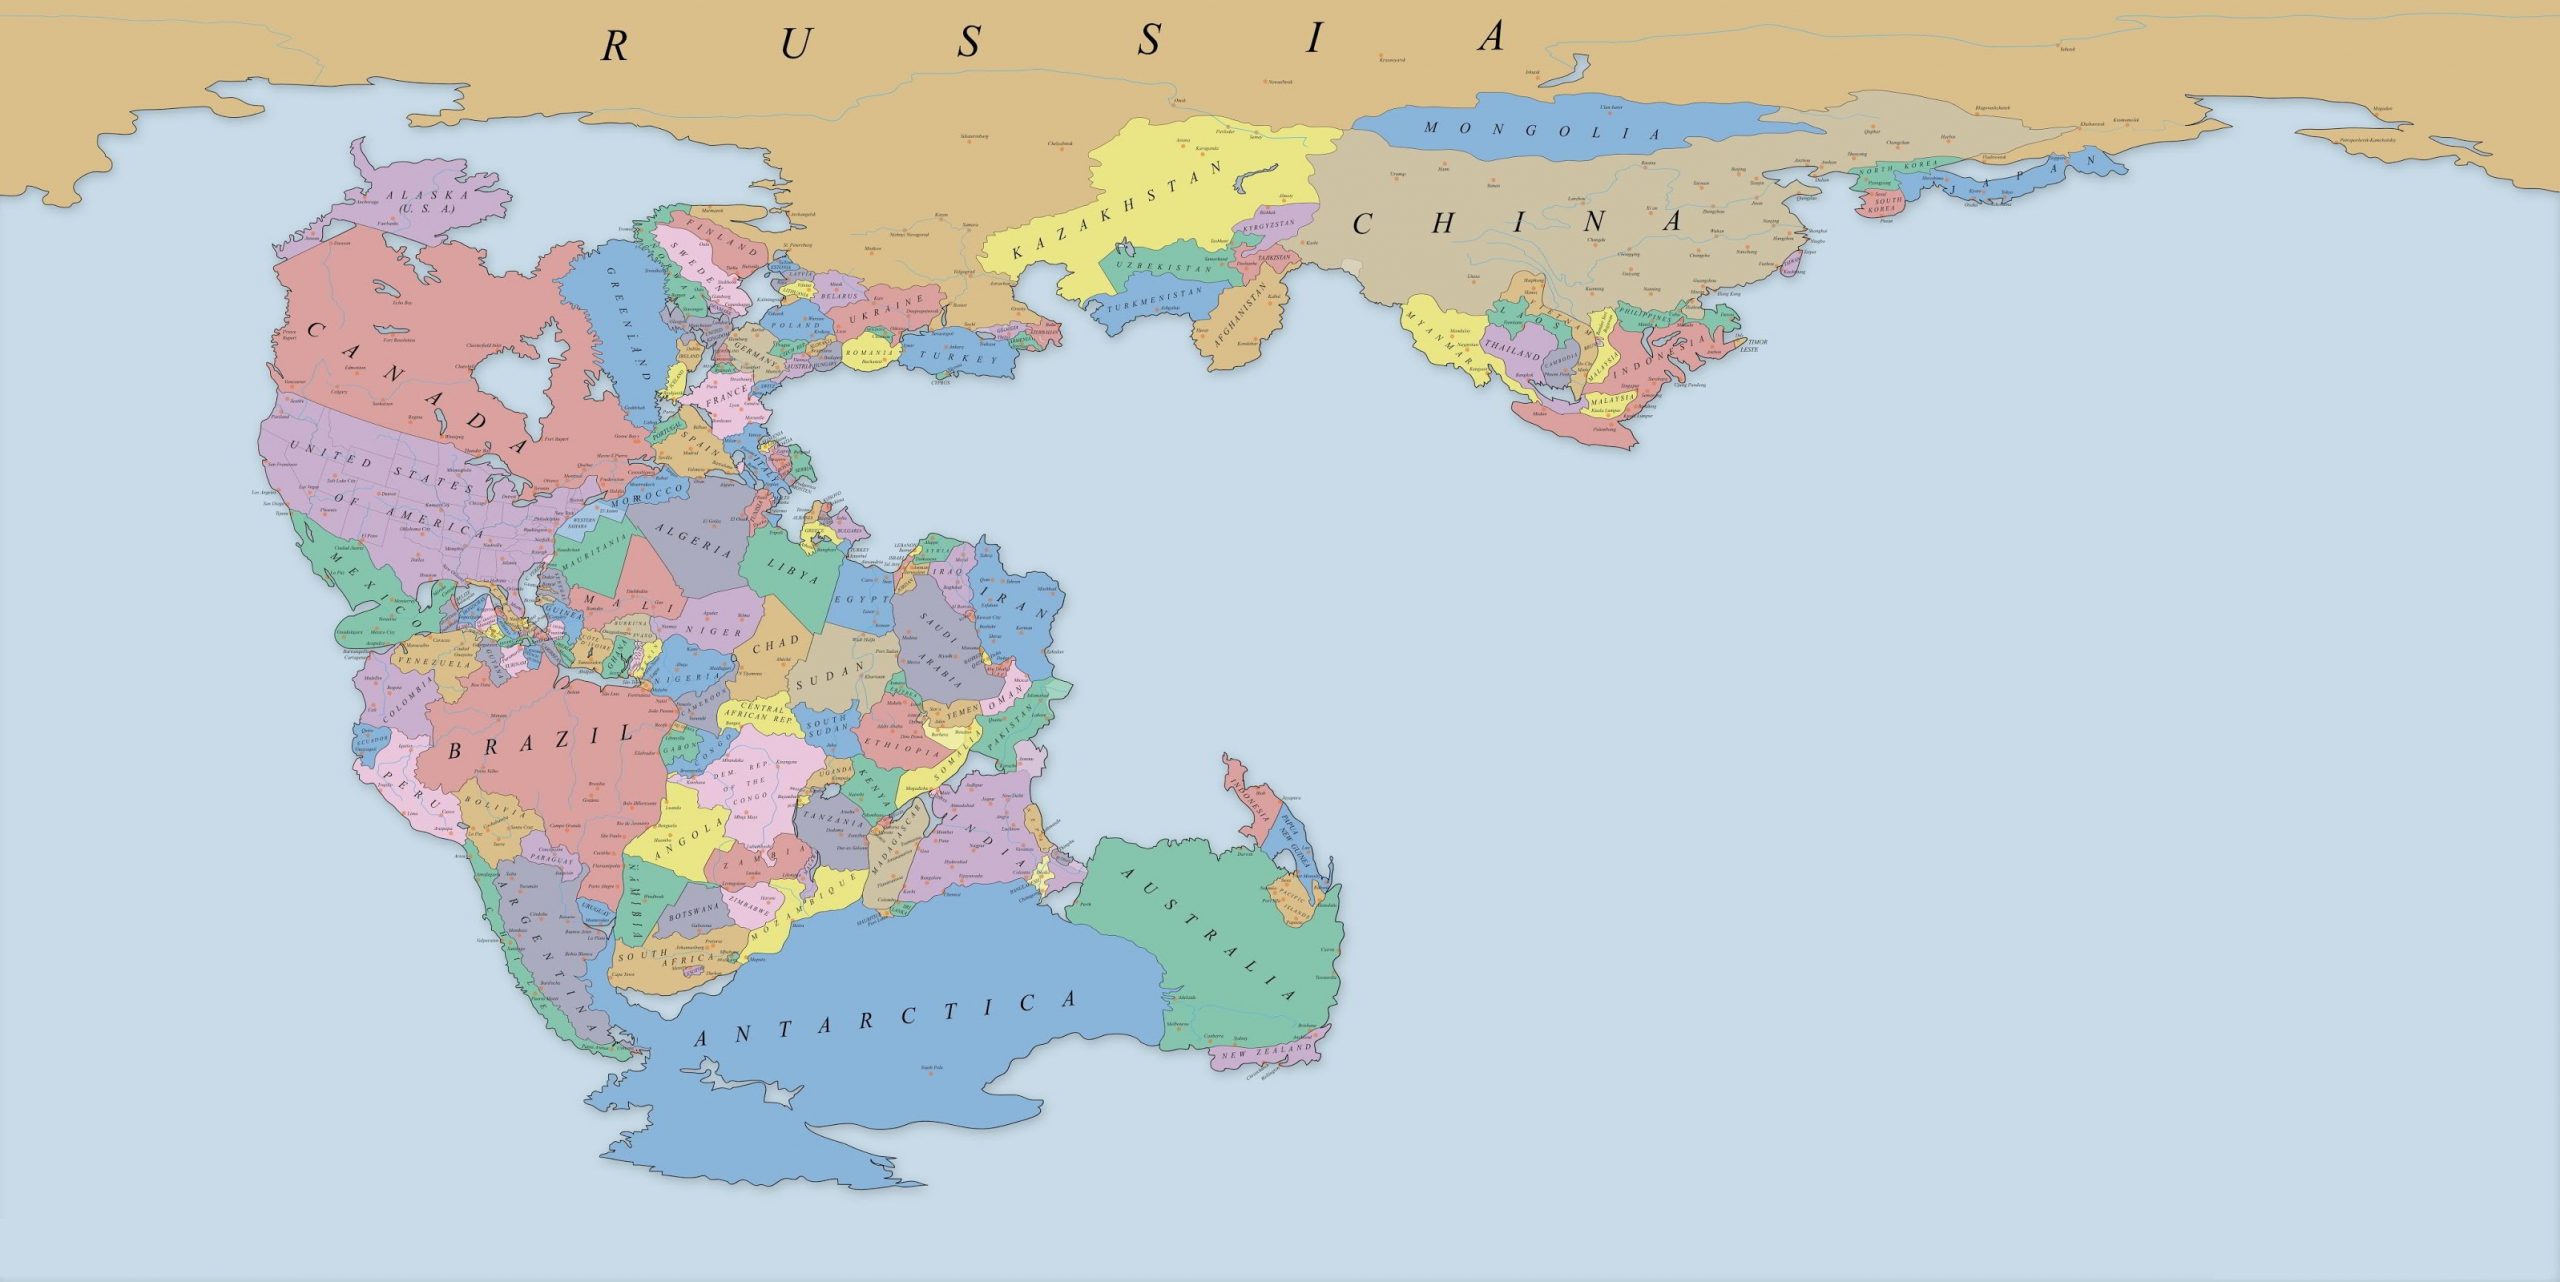
The globe near the top is the quickest way to explore the reconstruction. The full, rectangular map below is for when you want to inspect the country labels and borders without the curve of a sphere.
Massimo Pietrobon created the initial map in 2012 and later updated it. Open the image for its high-resolution version.
Why a rectangular map can become a globe
The map uses an equirectangular projection: its horizontal axis runs around the world and its vertical axis runs from pole to pole. That gives the globe a stable texture to wrap around a sphere. It does not turn the image into a plate-motion simulation or a survey-grade palaeogeographic model.
What this reconstruction can and cannot show
This is a cartographic thought experiment: a contemporary political map arranged on an ancient supercontinent. It is useful for seeing broad proximity and separation, not for locating a present-day capital, coastline or border at an exact point in deep time. Even scientific palaeogeographic reconstructions retain debated details, and modern political borders are a much later human layer on top of that uncertainty.5
References
- U.S. Geological Survey, "What was Pangea?" The USGS places the joined landmasses broadly between about 300 and 200 million years ago and describes early rifting between Africa, South America and North America. Retrieved August 14, 2026. ↩︎
- U.S. Geological Survey, "Historical perspective," This Dynamic Earth. The account distinguishes continental drift from the later plate-tectonic framework and discusses evidence from ocean-floor exploration. Retrieved August 14, 2026. ↩︎
- U.S. Geological Survey, "Wegener's Puzzling Continental Drift Evidence," which uses matching fossils and rock types alongside continental fit and notes that reconstruction details remain debated. Retrieved August 14, 2026. ↩︎
- U.S. Geological Survey, "Before the break-up of Pangaea," This Dynamic Earth. It explains why later geological processes obscure much older evidence and why reconstructions have different confidence across time. Retrieved August 14, 2026. ↩︎
- Massimo Pietrobon, "Pangea politica," 2012; Wu, Pisarevsky, Li, Murphy and Liu, "A new reconstruction of Phanerozoic Earth evolution," Tectonophysics, 2024. The source map is conceptual; the research paper explains why competing deep-time models can carry different assumptions about data, reference frames and longitude. Retrieved August 14, 2026. ↩︎
Here's how you can support viborc.com
We hope you like our content. You can support us in several ways. If you use ad-blocking software, please consider adding us to a safelist. When sharing our content, please link back to the source. When sharing on Instagram, please tag @viborccom. The same is for Twitter (@viborccom).
Thanks! Hvala! Danke! Дякую!