Archive · European Economy & Society
Inflation rates in Europe 2023 by country (Latest data and maps)
Latest inflation rates data for Europe in 2023 by country - maps and data for all European countries with relevant analysis.
Inflation and HICP
Inflation, a critical metric reflecting the overall movement in prices of goods and services, remains a paramount indicator for gauging economic stability and policy effectiveness across nations. Particularly in Europe, the Harmonized Index of Consumer Prices (HICP) has been instrumental in providing a standardized measure to compare inflation rates across different countries.
This index encapsulates the same set of goods and services across all countries, thereby enabling a coherent understanding of price movement trends. The recently collated data on inflation rates across various European nations, both within and outside the European Union (EU), delineates a vivid picture of disparate inflationary environments.
This analysis endeavors to examine this data, complemented by external authoritative sources such as EUROSTAT and respective national statistics agencies, to unveil a nuanced narrative of the economic panorama unfolding in these regions.
Target value of 2%?
The 2% inflation target is a widely accepted convention among many central banks globally as a hallmark of price stability and a healthy economy. This consensus emerged over time, with central banks recognizing that a low and stable inflation rate fosters a conducive environment for economic growth and employment. The 2% target strikes a balance – it's low enough to maintain purchasing power and prevent the arbitrary redistribution of wealth, while also providing a buffer against deflation, which can be detrimental to an economy.
Furthermore, a 2% inflation rate is seen as high enough to allow central banks to reduce real interest rates when needed, especially during economic downturns. This target also provides central banks with enough room to maneuver monetary policy, enabling them to maintain lower nominal interest rates, which can stimulate investment and consumption. The consensus on this target has been influenced by the historical performance and experiences of economies, and reflects a pragmatic approach towards maintaining a stable economic environment while providing flexibility to address economic challenges.
Euro Area and EU inflation dynamics
September 2023 witnessed a notable dip in the annual inflation rate within the Euro area to 4.3%, a significant decrease from 9.9% a year earlier. This decline was also mirrored in the EU's annual inflation, which dropped to 4.9% from 5.9% in August, and substantially down from 10.9% from the previous years. These figures, sourced from EUROSTAT, highlight a general easing of inflationary pressures across the majority of the EU, a trend resonating with the broader global economic recovery post-pandemic.
The data also shows that inflation rates decreased in 21 member states, remained unchanged in one, and escalated in five during September 2023. This pattern reflects a general easing of inflationary pressures across the majority of the EU, albeit with some exceptions. The specific dynamics and underlying factors driving these variances warrant a closer scrutiny to derive actionable insights for policy formulation and economic stabilization.
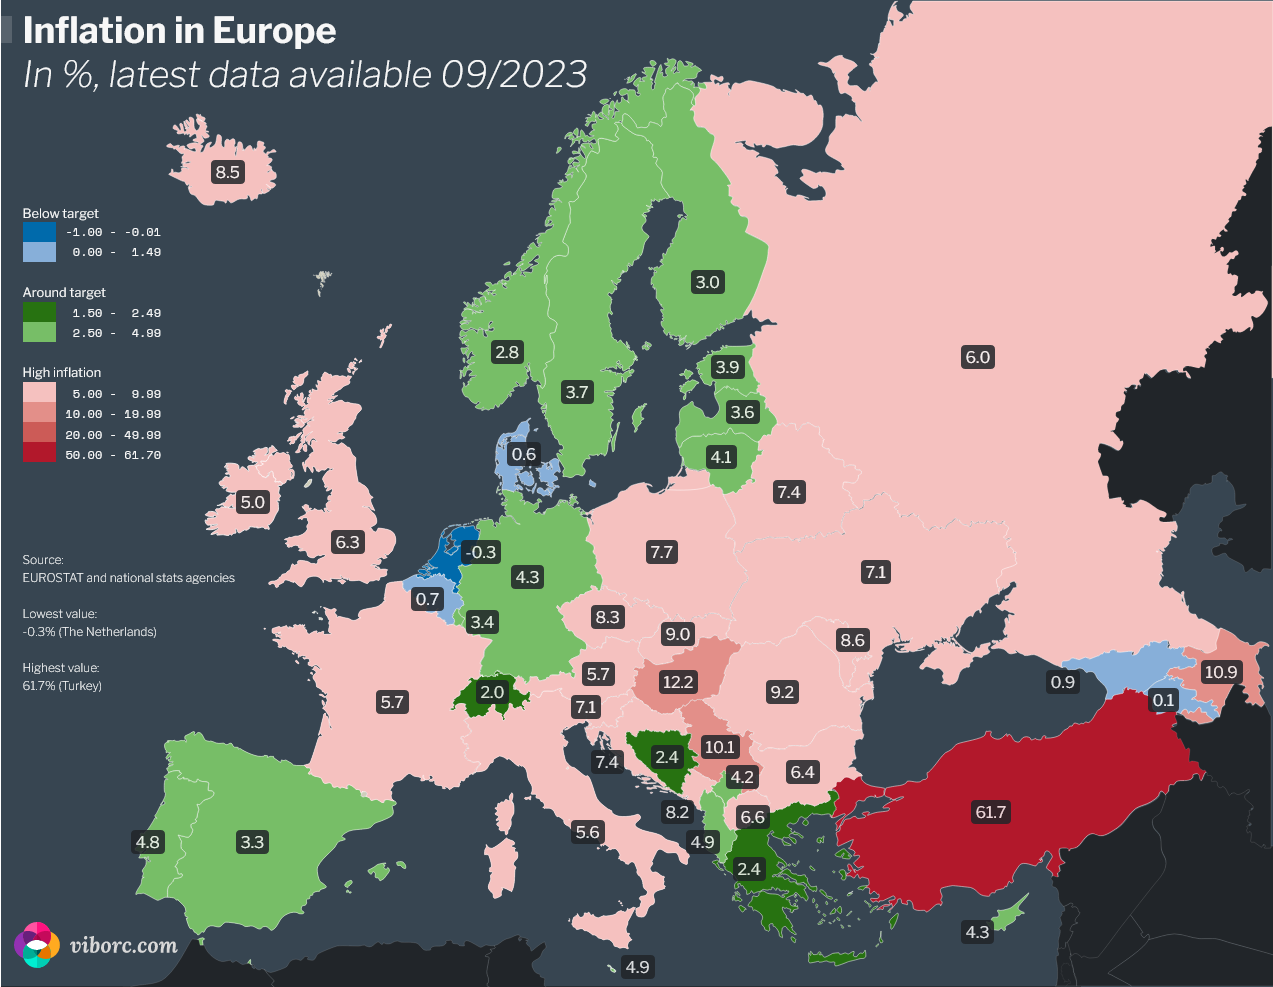
Inflation rates in Europe - detailed map and data
Countries with the lowest and highest inflation rates in Europe
Lowest inflation rates in Europe (September 2023)
Scroll horizontally
| COUNTRY | INFLATION RATE (%) |
|---|---|
| Netherlands | -0.3% |
| Armenia | 0.1% |
| Denmark | 0.6% |
| Belgium | 0.7% |
| Georgia | 0.9% |
Highest inflation rates in Europe (September 2023)
Scroll horizontally
| COUNTRY | INFLATION RATE (%) |
|---|---|
| Turkey | 61.7% |
| Hungary | 12.2% |
| Azerbaijan | 10.9% |
| Serbia | 10.1% |
| Romania | 9.2% |
Broader economic and geopolitical context
The data in focus encapsulates the inflation rates across 39 European countries. It is unveiling a significant variance in inflation rates from one nation to another. For instance, Turkey is grappling with a soaring inflation rate of 61.7%, while at the other extreme, Armenia is witnessing a minimal inflation rate of 0.1%.
A closer examination of the data reveals discernible geographical and political patterns. For instance, within the European Union, member states exhibit a moderate range of inflation rates on average. Belgium and Denmark are on the lower end of the spectrum with inflation rates of 0.7% and 0.6% respectively, while others like Hungary and Romania are experiencing elevated rates of 12.2% and 9.2% respectively.
The variance in inflation rates across different European nations underscores the complex interplay of economic structures, trade dynamics, and monetary policy stances. High inflation rates in certain Central and Eastern European (CEE) countries such as Hungary, Poland, and Romania could be tethered to a somewhat faster economic recovery post-pandemic, supply chain disruptions, and escalating energy costs.
In contrast, the non-EU members demonstrate a broader spectrum of inflation rates, with Turkey's exorbitant rate juxtaposed against modest rates in Bosnia and Herzegovina and Switzerland.
Noteworthy is the negative inflation rate of -0.3% in the Netherlands, a phenomenon known as deflation. This occurrence (if lasting for longer periods of time) warrants a closer scrutiny. Deflation can signal underlying economic issues – such as reduced consumer spending or overproduction – which could potentially hinder economic growth.
Conversely, geopolitical tensions, russian war of agression against Ukraine and sanctions are influencing inflation rates where it reached a 6.0% inflation rate.
The alarming inflation scenario in Turkey, with a rate of 61.7%, is emblematic of political instability, economic mismanagement, and persistent currency depreciation impacting price stability.
Croatia's transition to Euro and inflation implications
On 1 January 2023, Croatia embraced the Euro, marking its entry as the 20th member of the Euro area. This transition, while anticipated to bring forth economic benefits, also aroused concerns regarding potential price hikes.
Post-adoption, the impact on inflation was relatively mild according to both the European Central Bank (ECB) and the Croatian Central Bank (HNB). Specifically, the changeover-related inflation for January and February was noted to be 0.4 percentage points, a modest increase attributed to the currency transition.
Furthermore, the Harmonised Index of Consumer Prices (HICP) for these months indicated a moderating trend in annual inflation. We can see it declining from 12.7% in December 2022 to 12.5% in January 2023, and further to 11.7% in February 2023.
This trend underscores the relatively mild inflationary impact of the Euro adoption, aligning with the broader European inflation dynamics.
Implications and future outlook
The heterogeneous inflationary landscapes across Europe underscore the exigency of an intricate, multidimensional approach.We need such approach to understand and navigate the underpinning factors propelling inflation. The given data, coupled with supplementary insights from reputable sources such as Eurostat and national statistics agencies, accentuates the myriad economic and geopolitical influences at play.
What follows are the implications and the prospective outlook based on the analyzed data and its contextual underpinnings.
Policy formulation and strategic roadmapping
The analyzed inflation data facilitates a granular understanding of the economic pulse across Europe, a pivotal foundation for solid policy formulation.
Policymakers, with a nuanced comprehension of the inflationary dynamics, can architect more tailored monetary and fiscal strategies to mitigate inflationary pressures and foster economic stability. The conspicuous inflation disparities, for instance between Hungary and Denmark, beckon a calibrated policy approach aligned of the unique economic architectures and external influences each nation deals with.
Investor confidence and market stability
Investor sentiment is invariably tethered to the inflationary climate. The mild inflation impact post Croatia’s Euro adoption, as articulated by the European Central Bank and the Croatian Central Bank, is a testament to the market stability engendered by prudent monetary transitions.
Conversely, the staggering inflation rate in Turkey could potentially deter foreign investments and exacerbate economic volatility. Through a meticulous analysis of the inflation data, stakeholders can gauge the investment climate and market stability, thus making informed investment decisions.
Forward-looking economic resilience
As European nations continue their economic recuperation journey, the insights derived from the inflation data serve as a vanguard for anticipating and preparing for future economic challenges. The evolving geopolitical scenarios, trade dynamics, and global economic trends warrant a vigilant, forward-looking approach to bolster economic resilience and ensure price stability across the continent.
Academic implications
The academic discourse around inflation dynamics is enriched by a thorough analysis of real-time data juxtaposed against the theoretical underpinnings. The practical implications extend to policymakers, investors, and the broader economic community. As such they are forging a pathway for informed decision-making, academic inquiries, and pragmatic economic discourse.
Technological and analytical advancements
The role of technological and analytical advancements cannot be overstated in dissecting the inflation data. The emergence of sophisticated data analytics tools and models facilitates a more profound understanding of the inflationary trends and their drivers. This confluence of technology and economics could herald a new epoch of data-driven policy formulation and economic analysis, anchoring a more informed and effective approach to managing inflation and fostering economic prosperity.
In summation, the detailed scrutiny of the inflation data, contextualized within the broader economic and geopolitical milieu, furnishes a robust foundation for informed policy formulation, strategic economic planning, and academic discourse. The forward-looking analysis underscores the imperative of a multidimensional, data-driven approach to navigate the complex economic landscape, ensuring price stability, and fostering sustainable economic growth across Europe.
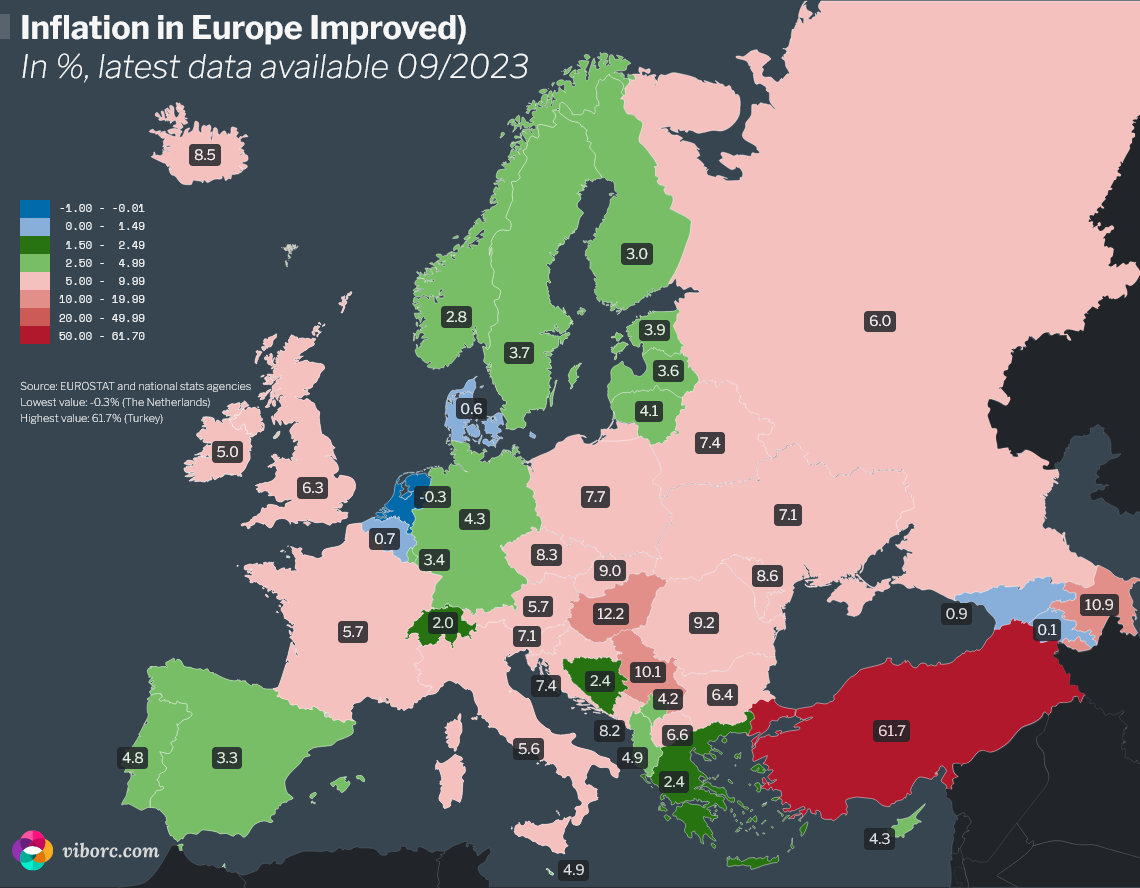
Changes to the initial map
In my initial attempt to visualize European inflation data, the chosen color scheme appeared suitable. Yet, upon sharing my work, the Reddit community swiftly highlighted its inadequacies.
This feedback served as a catalyst, urging me to delve further and hone my approach. Although a humbling journey, it's been profoundly instructive. Now, with a refined grasp and an updated color scheme, I'm eager to share the garnered insights and enhancements with the wider community. Check out the tutorial for inflation data visualization and a case study.
Here's how you can support us
We hope you like our content. You can support us in several ways. If you use ad-blocking software, please consider adding us to a safelist. When sharing our content, please link back to the source. When sharing on Instagram, please tag @viborccom. The same is for Twitter (@viborccom).
Thanks! Hvala! Danke! Дякую!