Why this matters: Healthy life expectancy at birth and general life expectancy at birth are two critical numbers reflecting a specific country’s general population health, quality of life, and long-term public health standards.
What’s the difference: First things first – healthy life years (HLY) are not the same as life expectancy.
- Healthy life years at birth are also called disability-free life expectancy, defined as the number of years a person can expect to live in a healthy condition, without major health problems or activity limitations.
- Life expectancy at a certain age is a different measure. It’s a number of years that a person of a certain age can expect to live if, for the rest of their life, they will experience current mortality conditions.
European Union: Healthy years at life data
Show me the numbers: The latest EUROSTAT data available (for 2020) shows that the number of healthy life years at birth for people living in the European Union is 64.5 years for women and 63.5 years for men.
There are big differences between specific EU member states on how many years people will have in good health.
For example, women in Sweden expect to have 72.7 years of a healthy life, while women in Latvia expect only 54.3 years of healthy life. That’s 18.4 years of difference.
The situation for men is similar. Again, Swedes can expect to live 72.8 healthy years of life (even higher than women in Sweden!), while Latvian men can hope for 52.6 years of healthy life. That’s 20.2 years difference!
Who has more healthy years at birth, women or men? In most EU countries (20), women can expect to live longer healthy years. While most differences are smaller, there are seven cases where women outlive men in healthy years by more than 2 years.
For example, women in Bulgaria can expect to have 4.2 healthy years (67.8) more than Bulgarian men, who can count on 63.6. years of healthy life.
There are several countries where a man can expect more healthy years at birth than a woman.
For example, Norwegian men will have 3.8 years longer than women (70.5 years, compared to 66.7 for women).
Other countries where men will have more healthy years at birth are:
- The Netherlands
- Portugal
- Finland
- Luxembourg
- Switzerland
- Sweden
- Denmark.
Spain is the only country where men and women can expect to have the same number of healthy years at birth – 66.30.
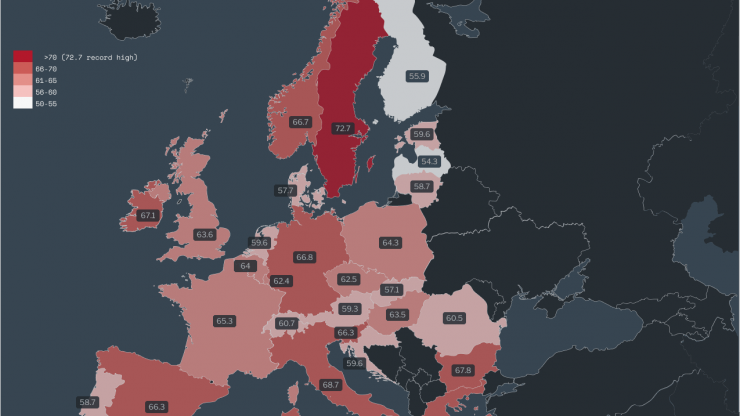
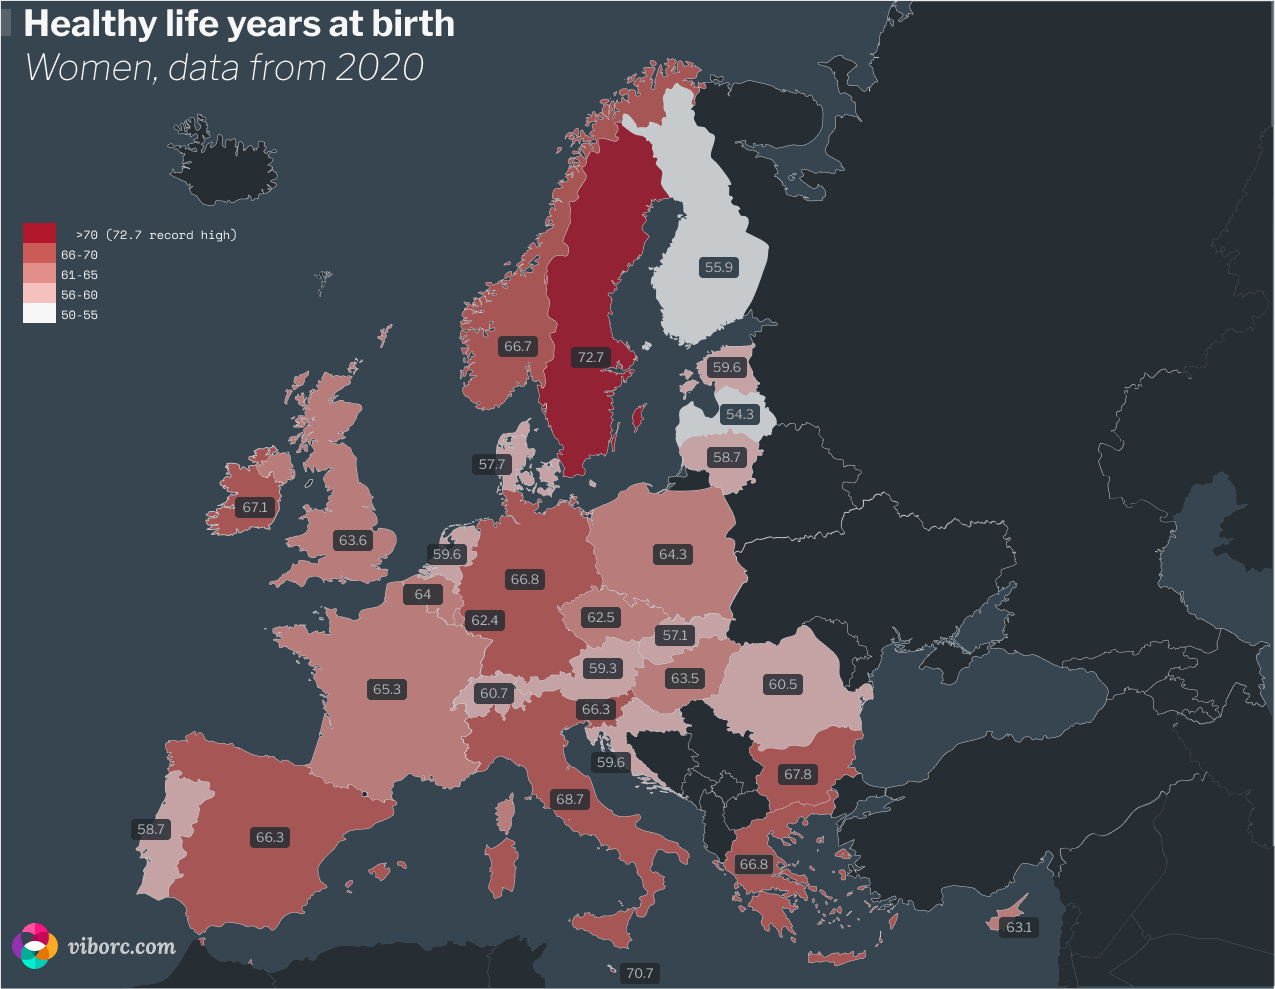
Map of expected healthy life years at birth for EU (+ UK, Norway, and Switzerland)
Women
Women, on average, can expect to live 64.5 healthy years in European Union. Click on the image for a bigger map.
Men
Men, on average, can expect to live 63.5 healthy years in European Union. One year less than women. Click on the image for a bigger map.
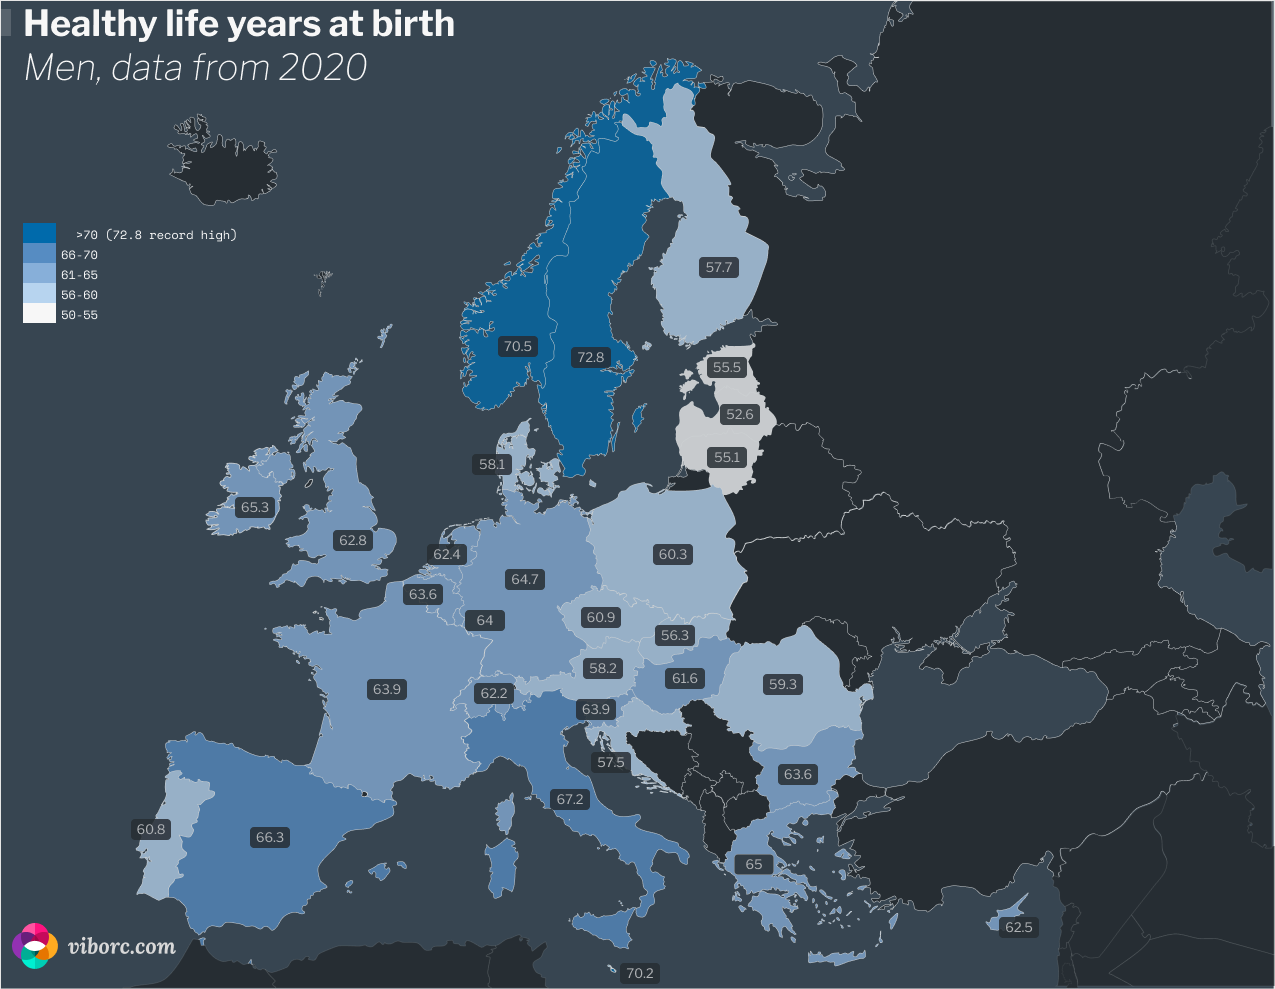
Table of expected healthy life years at birth for EU (+ UK, Norway, and Switzerland)
| MEMBER STATE | MEN (years) | WOMEN (years) |
|---|---|---|
| EU (average) | 63.5 | 64.5 |
| Austria | 58.2 | 59.3 |
| Belgium | 63.6 | 64.0 |
| Bulgaria | 63.6 | 67.8 |
| Croatia | 57.5 | 59.6 |
| Cyprus | 62.5 | 63.1 |
| Czechia | 60.9 | 62.5 |
| Denmark | 58.1 | 57.7 |
| Estonia | 55.5 | 59.6 |
| Finland | 57.7 | 55.9 |
| France | 63.9 | 65.3 |
| Germany | 64.7 | 66.8 |
| Greece | 65.0 | 66.8 |
| Hungary | 61.6 | 63.5 |
| Ireland | 65.3 | 67.1 |
| Italy | 67.2 | 68.7 |
| Latvia | 52.6 | 54.3 |
| Lithuania | 55.1 | 58.7 |
| Luxembourg | 64.0 | 62.4 |
| Malta | 70.2 | 70.7 |
| Netherlands | 62.4 | 59.6 |
| Norway | 70.5 | 66.7 |
| Poland | 60.3 | 64.3 |
| Portugal | 60.8 | 58.7 |
| Romania | 59.3 | 60.5 |
| Slovakia | 56.3 | 57.1 |
| Slovenia | 63.9 | 66.3 |
| Spain | 66.3 | 66.3 |
| Sweden | 72.8 | 72.7 |
| Switzerland | 62.2 | 60.7 |
Data sources: EUROSTAT, ONS (UK)
ABOUT THE AUTHOR
")


")


