Why it matters: Understanding the complex economic relations within the European Union and its member states is crucial for Europe’s policies. Richer countries contribute more to the shared budget, and poorer countries try to achieve convergence towards higher GDP values. Many programs and funds exist within the EU to support that convergence.
What are PPP and PPS: Purchasing power parities (PPP) are economic indicators of price level differences between countries. Instead of just looking at the GDP per capita, PPP tells us how many currency units a given quantity of services or goods costs in different countries.
Closely related to PPP is PPS (purchasing power standard). In simplest terms, PPS is an artificial currency unit. Theoretically, one PPS buys you the same quantity of services and goods in each country.
But there’s a challenge since there are price differences between different countries, and you will need different amounts of national currency units to buy the same amount of services or goods. So, to get the PPS value, you need to divide any economic aggregate of a single country in national currency by its specific PPP.
Why do we express GDP per capita in PPS? Expressing GDP per capita in PPS is useful when comparing different countries and their economic standards. It effectively eliminates price level differences and allows for meaningful volume comparisons.
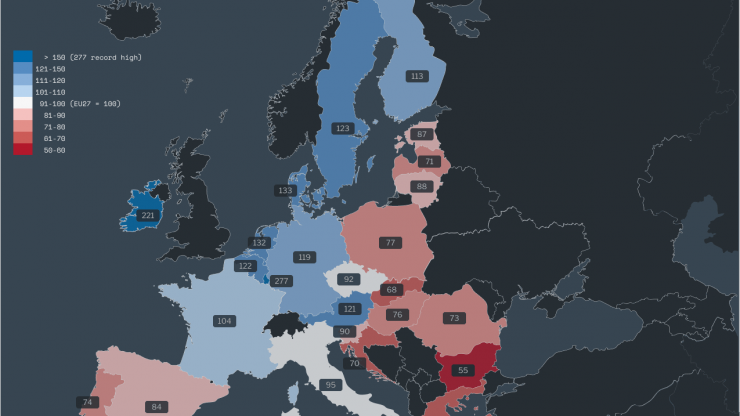
Show me the map: Ranging from 55% of the EU average in Bulgaria to 277% in Luxembourg, GDP per capita expressed in PPS paints a picture of stark differences among member states.
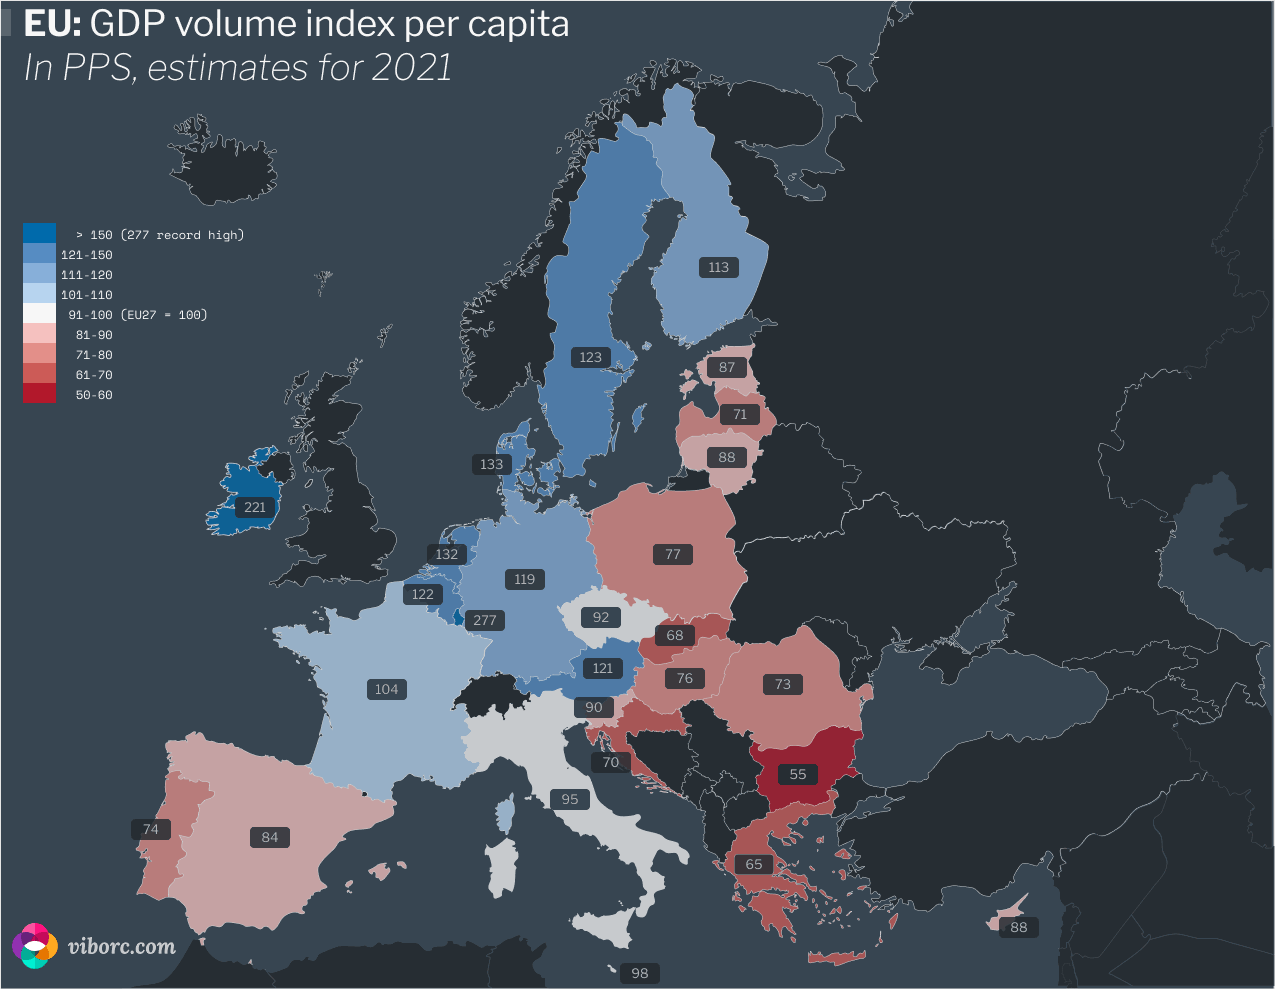
Table of European Union GDP volume index per capita (in PPS, estimates for 2021)
| MEMBER STATE | GDP per capita in PPS, EU27=100 |
|---|---|
| Bulgaria | 55 |
| Greece | 65 |
| Slovakia | 68 |
| Croatia | 70 |
| Latvia | 71 |
| Romania | 73 |
| Portugal | 74 |
| Hungary | 76 |
| Poland | 77 |
| Spain | 84 |
| Estonia | 87 |
| Cyprus | 88 |
| Lithuania | 88 |
| Slovenia | 90 |
| Czechia | 92 |
| Italy | 95 |
| Malta | 98 |
| European Union – 27 | 100 |
| France | 104 |
| Euro area – 19 countries (2015) | 105 |
| Euro area – 18 countries (2014) | 105 |
| Finland | 113 |
| Germany | 119 |
| Austria | 121 |
| Belgium | 122 |
| Sweden | 123 |
| Netherlands | 132 |
| Denmark | 133 |
| Ireland | 221 |
| Luxembourg | 277 |
What’s the source: The original dataset was produced by Eurostat.
ABOUT THE AUTHOR
")


")


